It’s November 5th, and I’m just now recovering from my second hackathon ever. Today, I want to talk about that.
Table of Contents
My First Hackathon
About a year ago, I decided to push myself into an uncomfortable situation in the hopes of making a few new friends. In other words, I decided to form a team for the Hack OHI/O hackathon at The Ohio State University.
To do that, I sent a message out on Piazza, an internal forum of fellow grad students, asking if anyone wanted to form a team. Luckily, I got several takers—some of which I had to turn away.
When the event rolled around, I met my team for the first time. Apparently, we had been taking courses together, but we never actually met.
At any rate, we then proceeded to spend the first several hours arguing about what we wanted to do. Eventually, we settled on a disaster relief project for a company where we mined Twitter data to determine where disasters might be happening. If you’re interested in that project, I still have the GitHub repo .
.
After several hours of fighting with APIs and each other, we gave up. That evening, we walked home without anything to show for our 10+ hour effort. Obviously, that was pretty frustrating, but I wasn’t discouraged. I wanted to do it again!
My Second Hackathon
Luckily, the story doesn’t end there. In this section, we’ll talk about how things were different this time around.
Team Formation
This year, I decided not to leverage Piazza and the pool of department grad students. Instead, I chose to attend a team forming event hosted by Hack OHI/O. That’s where I bumped into my new team.
Unlike last year, I was able to meet my new team before the event. As a result, we were able to do a little planning while exchanging contact information. Of course, we opted to wait until the event to see what challenges were available.
That said, I also got some food out of the deal, so I’d recommend this option to anyone looking for a team!
Morning Keynote
During the morning of the hackathon, there was check-in, breakfast, and a keynote. Naturally, I got there nice and early. I can’t say the same about my teammates—one of which showed up with three minutes to spare.
By the time the keynote kicked off, I felt a little uneasy. After all, I don’t love the tech community. In general, I find it pretty toxic, and environments like this only reinforce that belief. Unfortunately, a lot of the speeches didn’t really make me feel better.
For example, one of the presenters spoke a lot about the negative aspects of tech as if they were perks. Specifically, they mentioned that their current company had been acquired, and the transition had been causing them to lose a lot of sleep. Is that really a culture that you want upcoming developers to expect? That’s exploitation.
In addition, the same presenter kept talking about how the education of the department accurately reflects the reality of tech. For instance, we have a lot of silly rules like “no multiple return statements” and “always declare variables in their innermost scope.” As someone who has been in industry, I don’t believe that everything I teach is universal. Tech is just far more nuanced than that, yet this guy was speaking in black and white “facts.”
To make matters worse, the department chair gave a little speech where he mentioned that the department was over budget, so they were going to stop admitting students to the major. How’s that to kick off a hackathon?
Overall, I felt like this cold environment perfectly mirrored my experience with industry, and it reminded me why I left in the first place. That said, I’m not a fan of conditioning young people into getting used to that culture. They should be the agents for change!
Selecting a Challenge
Rant aside, we were finally able to start planning after the keynote. Like last year, we decided to do one of the sponsor’s projects. For the sake of argument, here were a few of the challenges:
Create a dashboard displaying energy data from the 490 buildings at Ohio State. What does it look like? How does it function? How would you make kilowatt hours and BTUs understandable to the general population? Your project has the chance to be implemented right here at Ohio State and impact over 100,000 people every day.
Engie, 2019
Azure Cognitive Services are a set of tools you can use to add intelligence to your apps and projects. This includes services for image processing, natural language processing, recommendations, search, and much more. What can we build with Azure Cognitive Services? Anything and everything! We encourage you to think about how AI can address a user problem. For example, how can you use AI to improve student life or day to day productivity?
Microsoft, 2019
Hack on any financial technology project that gives back to your community in a positive way. If you don’t have a specific idea, you can consider address one of the below themes. For example, using technology to:
JPMorgan Chase, 2019
– Improve Financial Literacy
– Empower Minority Small Business Owners Entrepreneurs
– Address the Student Loan Debt Crisis
– Help Natural Disaster Victims with Access to Emergency Money
– Making Banking Easier for the Physically Disabled
Ultimately, we settled on the Engie project. I don’t really remember why…
Planning
At any rate, after we selected a project, it was a matter of deciding what we wanted to do. Since the Engie project was data-driven, we decided to put together a data visualization dashboard.
At a high level, we knew we wanted to build a web application with a few graphs to represent campus energy usage. As a result, we split into two teams to focus on the two main features: the graphs and the dashboard.
As someone interested in data visualization, I ended up on the graph team. At that point, we decided to first look at the data. In our case, we had a handful of CSV files with millions of rows of energy data.
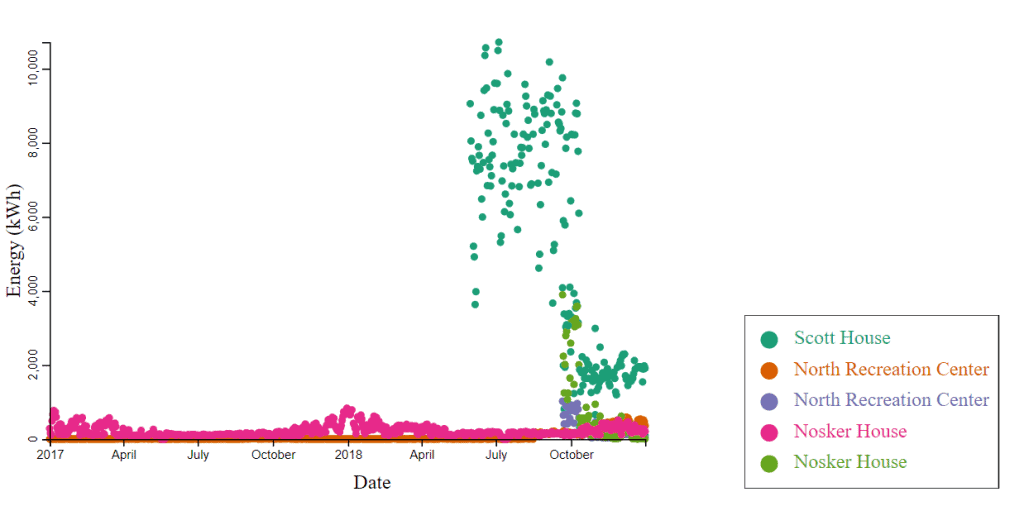
Ultimately, we decided to put together a graph of time series energy data for each building and meter on campus. However, since there are nearly 400 buildings, we couldn’t possibly plot all of them (especially not in D3). As a result, we had to think about ways of handling that much data.
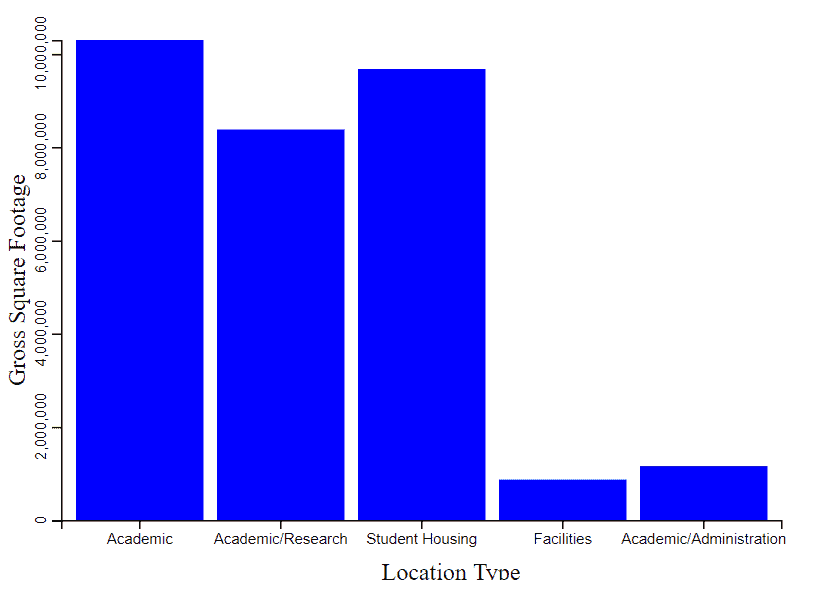
In addition, we also wanted to make a bar chart of average energy usage by category (e.g. academic, facilities, research, etc.). Then, we could use that bar chart to select a subset of buildings to plot on the first graph.
As a result, we would have two plots with plenty of interaction. Naturally, it was up to the other team to provide a landing page with plenty of filtering options for us to integrate.
Final Product
At the end of the 25 hours, we managed to integrate the graphs with the web app. Unfortunately, the web app was built using ASP.NET, so we don’t have the final product deployed. However, you can play with the graphs using my GitHub Pages prototype.
When you open the prototype, you’ll be greeted with a sample graph that’s generated from 5 arbitrary campus buildings:

If you hover over the points on this graph, you see each point enlarge with information about that point displayed in the upper left corner.
Then, next to that graph (or below on smaller screens) is the bar graph. For the sake of time, we weren’t able to compute categorical averages, so we used square footage instead:

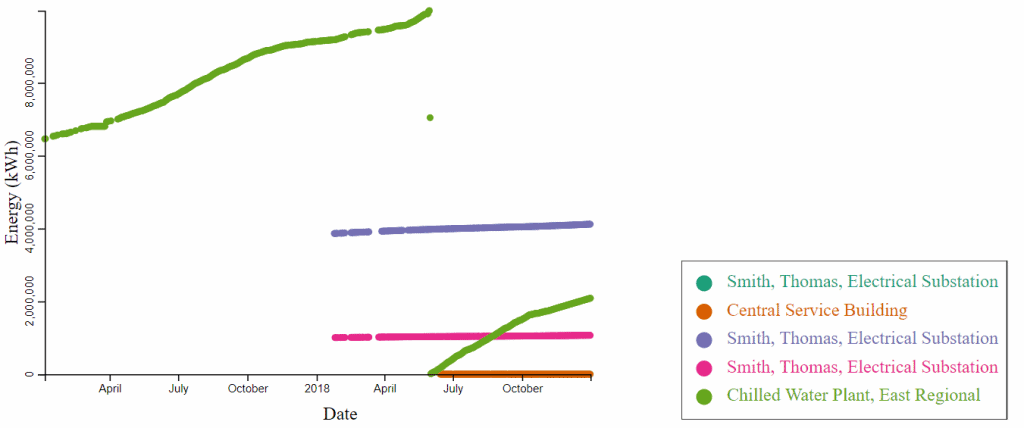
When a bar on this graph is selected, it filters the first plot. For example if you select facilities, you get the following plot:

Ultimately, these plots would be displayed on a nice web page for browsing. If you’re interested in checking out the actual code that generates these graphs, see the dashboard folder in the hackathon 2019 repo .
.
Judging
After the hackathon, we decided to enter our solution for judging. Of course, we had seen some of the other solutions, so we weren’t exactly planning to win. That said, we didn’t want to leave without sharing our project. After all, why would we quit at that point?!
For about 2.5 hours, we sat around and waited for judges to come around to ask us about our project. Naturally, our project was judged three times by various campus faculty and industry folks. If you’re interested in the results of those scores, you can check out this PDF breakdown. To summarize, we scored a 36.75 out of 50—although I don’t agree with their math—which placed us in the 67.40 percentile. Not bad!
Ultimately, we ended up heading to the showcase before realizing that we weren’t finalists. At that point, I grabbed a matcha cheesecake and went home to rest.
Reflection
Overall, I had a ton of fun. In fact, I was a lot happier this time around. After all, my team was just trying to make something. We weren’t bickering about every detail.
Of course, the biggest highlight of the event was the swag and the food. By the time the hackathon was over, I had eaten 5 meals and escaped with plenty of shirts and other cool swag. In other words, I’d say it was worthwhile, and I totally plan to go again.
Have you ever done a hackathon? If so, how did it go? Do you have any work to share? What did you enjoy about it? What would you have liked them to do better? If not, would you want to go to one? What would you like that experience to look like?
One of my long term goals is to host an inclusive hackathon which focuses on the collaborative—rather than the competitive—nature of software. If you’d like to help me get there, hop on over the Patreon and pledge a couple bucks! Even better, tell your friends about this blog and join my mailing list.
As always, thanks again for your support! I appreciate it.
Recent Posts
It's July 2024, and I have three chapters of my dissertation drafted! Two more and we'll be ready to defend.
In growing the Python concept map, I thought I'd take today to cover the concept of special methods as their called in the documentation. However, you may have heard them called magic methods or even...

