If you’ve tried playing with data visualization in Python, you’ve almost certainly experimented with Matplotlib and Pandas. That said, I’d argue there’s an even better alternative that has significantly more options and flexibility: Plotly. And, today I’m going to go over how to use Plotly to make a web-based data visualization dashboard in less than 20 lines of code.
Table of Contents
Tools You Need
To be able to use Python to create a simple visualization dashboard, you’re going to need a few things:
- Plotly
- Dash
Plotly is a data visualization library which lets you create plots of various types. To install it, you can use pip like usual (assuming you already have Python installed):
pip install plotly
# if the previous line doesn't work, try one of these
py -m install plotly
python -m install plotly
python3 -m install plotly
Meanwhile, dash is a web application framework for building data visualization dashboards. You can install it just like above:
pip install dash
Chances are that dash will also install plotly, so you can start here if you like. In fact, the docs say you can skip directly to this step .
.
With that said, you’re just about ready to go. However, there are definitely libraries that are nice to have for data management. For example, you might want to make use of pandas, which the docs say is required for some of the features of plotly. To install pandas, try the following:
pip install pandas
And of course, because dependency management can be a pain, I’ve also made a requirements file that you may find handy as well. You can either download that file or copy the following text into a file called requirements.txt:
dash
pandas
Then you can use this to install all of the required packages with the following command:
pip install -r requirements.txt
No matter what you do, make sure you get these three packages installed (i.e., dash, pandas, and plotly). In fact, it’s probably best to use a virtual environment, but that’s outside the scope of this tutorial.
Getting Started With the Web App
Now, once you have all the packages installed, you can create your first dash web app in a couple of lines of code. First, you’ll want to import the dash class and instantiate it:
import dash
app = dash.Dash()
From there, all you have to do is run the app:
if __name__ == '__main__':
  app.run_server(debug=True)
Depending on your familiarity of Python, this code might not be obvious. That said, this is basically the way we handle the “main” method in Python. Regardless, these lines will boot up a server for the app, at which point you’ll see the following text on your screen:
Dash is running on http://127.0.0.1:8050/

 * Serving Flask app '__main__' (lazy loading)
 * Environment: production
     WARNING: This is a development server. Do not use it in a production deployment.
     Use a production WSGI server instead.
 * Debug mode: on
If all is well, you can copy that URL into your browser. When I do that, I’m greeted with a wonderful set of errors:
Traceback (most recent call last):
  File "C:\Users\jerem\AppData\Local\Programs\Python\Python39\Lib\site-packages\flask\app.py", line 2091, in __call__
    return self.wsgi_app(environ, start_response)
  File "C:\Users\jerem\AppData\Local\Programs\Python\Python39\Lib\site-packages\flask\app.py", line 2076, in wsgi_app
    response = self.handle_exception(e)
  File "C:\Users\jerem\AppData\Local\Programs\Python\Python39\Lib\site-packages\flask\app.py", line 2073, in wsgi_app
    response = self.full_dispatch_request()
  File "C:\Users\jerem\AppData\Local\Programs\Python\Python39\Lib\site-packages\flask\app.py", line 1511, in full_dispatch_request
    self.try_trigger_before_first_request_functions()
  File "C:\Users\jerem\AppData\Local\Programs\Python\Python39\Lib\site-packages\flask\app.py", line 1563, in try_trigger_before_first_request_functions
    self.ensure_sync(func)()
  File "C:\Users\jerem\AppData\Local\Programs\Python\Python39\Lib\site-packages\dash\dash.py", line 1353, in _setup_server
    _validate.validate_layout(self.layout, self._layout_value())
  File "C:\Users\jerem\AppData\Local\Programs\Python\Python39\Lib\site-packages\dash\_validate.py", line 375, in validate_layout
    raise exceptions.NoLayoutException(
dash.exceptions.NoLayoutException: The layout was `None` at the time that `run_server` was called.
Make sure to set the `layout` attribute of your application
before running the server.
Just know that this means the app is working! We’ll look at solving this error in the next section.
Creating a Layout
With dash, we can create an HTML layout just like we would using HTML. To do that, we’ll need to set the layout variable:
import dash
from dash import html

app = dash.Dash()
app.layout = html.Div()

if __name__ == '__main__':
  app.run_server(debug=True)
Again, when you run this code, you’ll get the same URL. Head to it and check out your changes. Now that we’ve setup the layout, we’ll see that there is nothing on the page. This is expected because we’ve only created an empty div. To make sure something shows up on screen, let’s add a title:
import dash
from dash import html

app = dash.Dash()
app.layout = html.Div(children=[
  html.H1(children='My Dashboard')
])

if __name__ == '__main__':
  app.run_server(debug=True)
If done correctly, the webpage should automatically update with your new title. If you’re familiar with HTML, you can start using elements to create your own web page. For example, we might add a subtitle as follows:
import dash
from dash import html

app = dash.Dash()
app.layout = html.Div(children=[
  html.H1(children='My Dashboard'),
  html.Div(children='A practice visualization dashboard.')
])

if __name__ == '__main__':
  app.run_server(debug=True)
Keep a close eye on this layout variable. We’ll be using it to insert graphs later.
Creating a Plot
Now that we have a web app, we can begin visualizing some data. For this, we’ll be using a publicly available data set found here . In particular, we’re looking for a csv that we can load using Pandas. Luckily, the repo linked has several examples including some Apple stock data. To load it, we’ll use Pandas:
import pandas as pd
df = pd.read_csv("https://raw.githubusercontent.com/curran/data/gh-pages/plotlyExamples/2014_apple_stock.csv")
With the data loaded, we can create a figure as follows:
import plotly.express as px
fig = px.line(df, x="AAPL_x", y="AAPL_y")
Now, this figure won’t show up in our website until we’ve added it to our layout. So, we need to go back to the section of the code that includes the layout and add a new HTML element:
import dash
from dash import html
from dash import dcc
import pandas as pd
import plotly.express as px

df = pd.read_csv("https://raw.githubusercontent.com/curran/data/gh-pages/plotlyExamples/2014_apple_stock.csv")
fig = px.line(df, x="AAPL_x", y="AAPL_y")

app = dash.Dash()
app.layout = html.Div(children=[
  html.H1(children='My Dashboard'),
  html.Div(children='A practice visualization dashboard.'),
  dcc.Graph(figure=fig)
])

if __name__ == '__main__':
  app.run_server(debug=True)
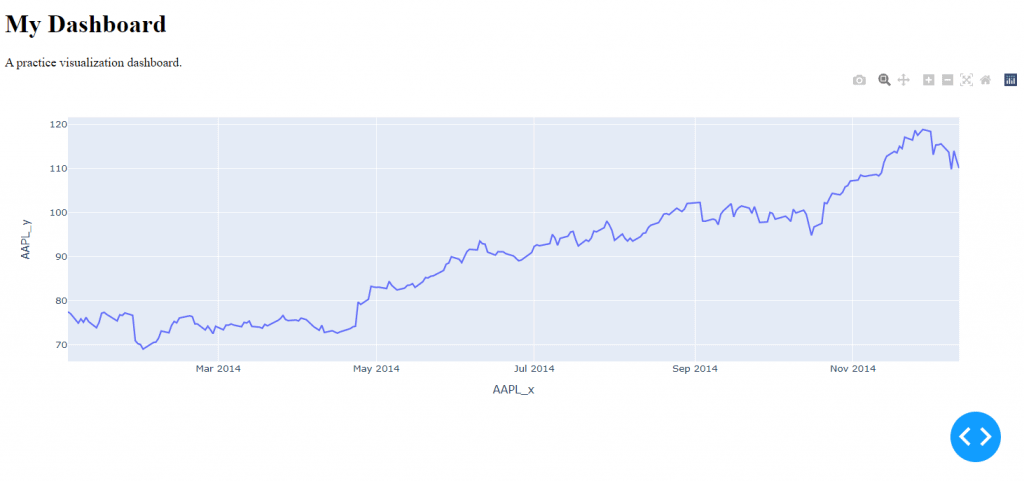
If all goes well, we should have a web page that looks like this:

Now, we have a web page with some data visualization in it! What makes this particularly cool is that the visualizations are all interactive right out of the box. For instance, you can scroll over data points to see their x and y values. How cool is that?
Looking Ahead
In the future, we’ll take a look at expanding this code to include other types of plots. For now, however, we’ll keep this code simple. If you have any particular types of plots you’d like to see, let me know. I’m really into data visualization, and I’d love to share more examples.
In the meantime, you can stick around and learn a bit more Python with me. For instance, here are some helpful places to get started:
- 100 Python Code Snippets for Everyday Problems
- 8 Coolest Python Programming Language Features
- Programmatically Explore Code Snippets of Many Languages Using Python
Also, I’d appreciate it if you took a second to check out some of the following Python resources (#ad):
- Effective Python: 90 Specific Ways to Write Better Python

- Python Tricks: A Buffet of Awesome Python Features

- Python Programming: An Introduction to Computer Science

With that said, let’s call it for today! I’ll see you next time.
Recent Posts
It's July 2024, and I have three chapters of my dissertation drafted! Two more and we'll be ready to defend.
In growing the Python concept map, I thought I'd take today to cover the concept of special methods as their called in the documentation. However, you may have heard them called magic methods or even...

